Cost & Performance
Estimated cost and timing analysis for a completed workflow run. Available as a tab on the run detail page.
Availability
Only available for succeeded, non-resumed runs.
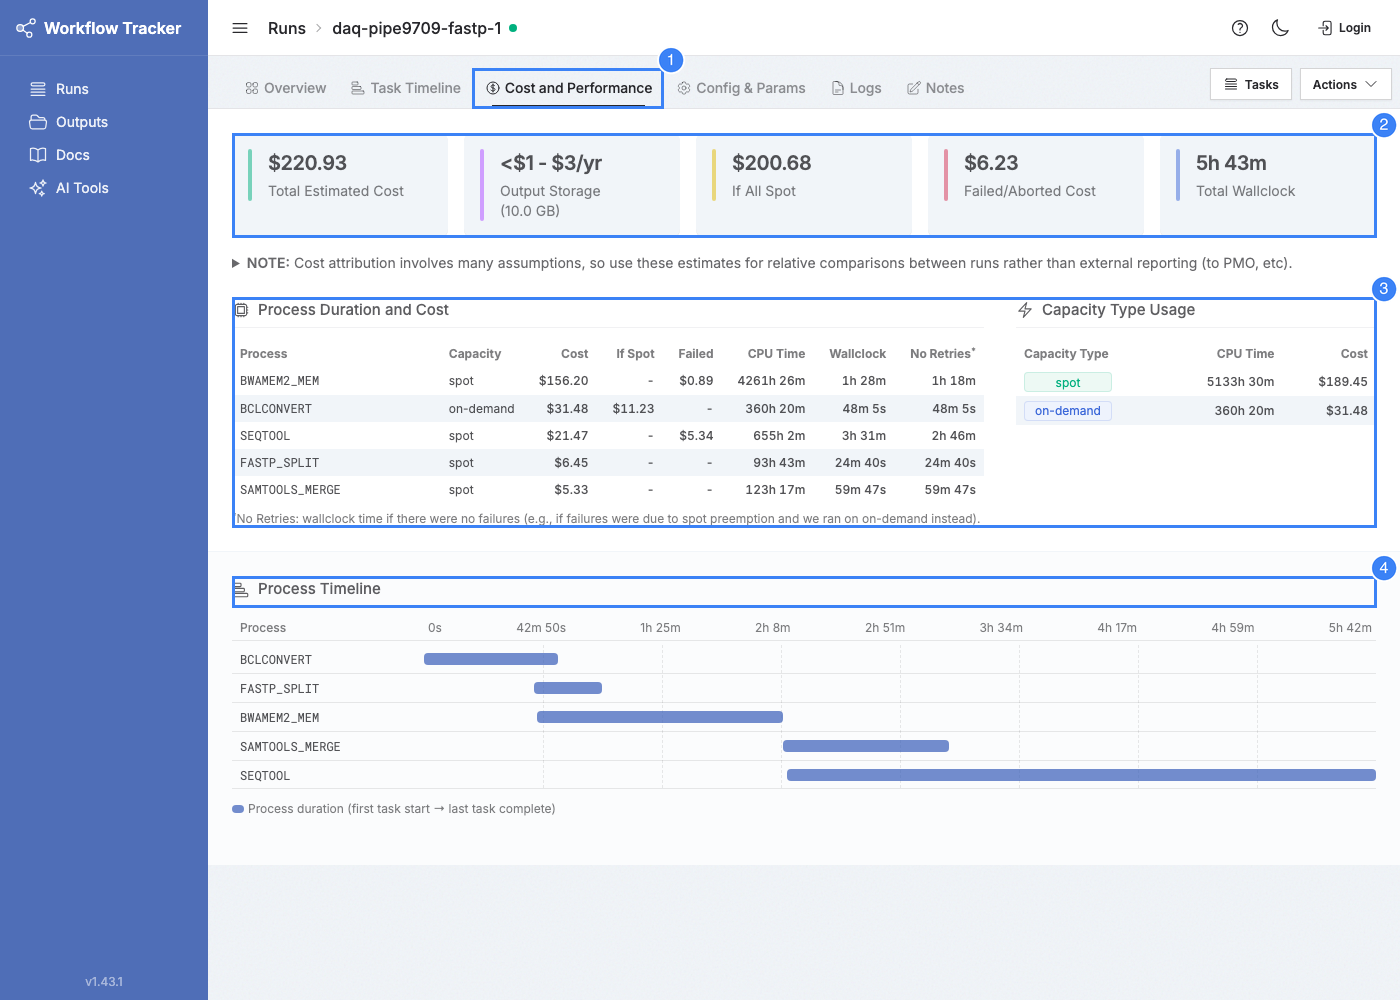
Summary Cards
| Card | Description |
|---|---|
| Total Cost | Estimated total cost for the run |
| Output Storage | Total size of published outputs and an annual S3 storage cost range under Intelligent-Tiering. Appears on this tab when the cost report is available (succeeded, non-resumed runs); the run detail page shows the size for any terminal run. Shows Deleted if outputs have been removed. |
| If All Spot | Hypothetical cost if every task ran on spot capacity |
| Wasted Cost | Cost from failed and aborted task attempts |
| Total Wallclock | End-to-end elapsed time |
Per-Process Table
Breaks down cost and timing by process, sorted by highest cost first.
| Column | Description |
|---|---|
| Process | Process name |
| Cost | Estimated cost |
| Wasted | Cost from failed/aborted attempts |
| If All Spot | Hypothetical cost if all tasks used spot |
| CPU Time | Total CPU time (duration x CPUs, summed) |
| Wallclock | First submission to last completion |
| Simulated Wallclock | Estimated wallclock without retries (details) |
| Capacity | Spot, on-demand, or mixed |
Capacity Breakdown
Usage split by spot vs. on-demand: cost and CPU time for each capacity type.
Process Timeline
A horizontal bar chart showing when each process was active. Helps identify parallel vs. sequential execution, synchronization points, and which processes dominate the critical path.
How Costs Are Calculated
Cost estimation uses 1-minute CPU-proportional slicing:
- For each minute, identify all task attempts running on each host
- Determine the host's hourly rate from its instance type and capacity type
- Divide the per-minute cost among concurrent tasks proportionally by CPU allocation
Cross-Run Cost Sharing
When multiple runs share an EC2 instance, host cost is split proportionally by CPU allocation across all concurrent tasks -- including tasks from other runs. This prevents double-counting on shared infrastructure.
Example: Two tasks on the same host -- one from this run (3 CPUs) and one from another (4 CPUs). This run's task gets 3/7 of that minute's cost.
Wasted Cost
Same algorithm, but only accumulates cost for failed or aborted attempts.
Simulated Wallclock
Assumes each task would have completed in the same duration as its succeeded attempt, starting at the earliest submission time across all attempts. Estimates how much faster the process would have run without failures.
Caveats
Use for Relative Comparisons
Cost estimates should be used for relative comparisons between runs, not for billing or external reporting.
Not included: S3 storage, data transfer, networking, negotiated discounts, node spin-up/down costs. Instance pricing is based on Tracker's database, which may lag real-time market rates.