Process Detail
Shows all tasks of a specific process within a workflow run, with resource usage statistics and a task table. Navigate here by clicking a process name in the Process Table.
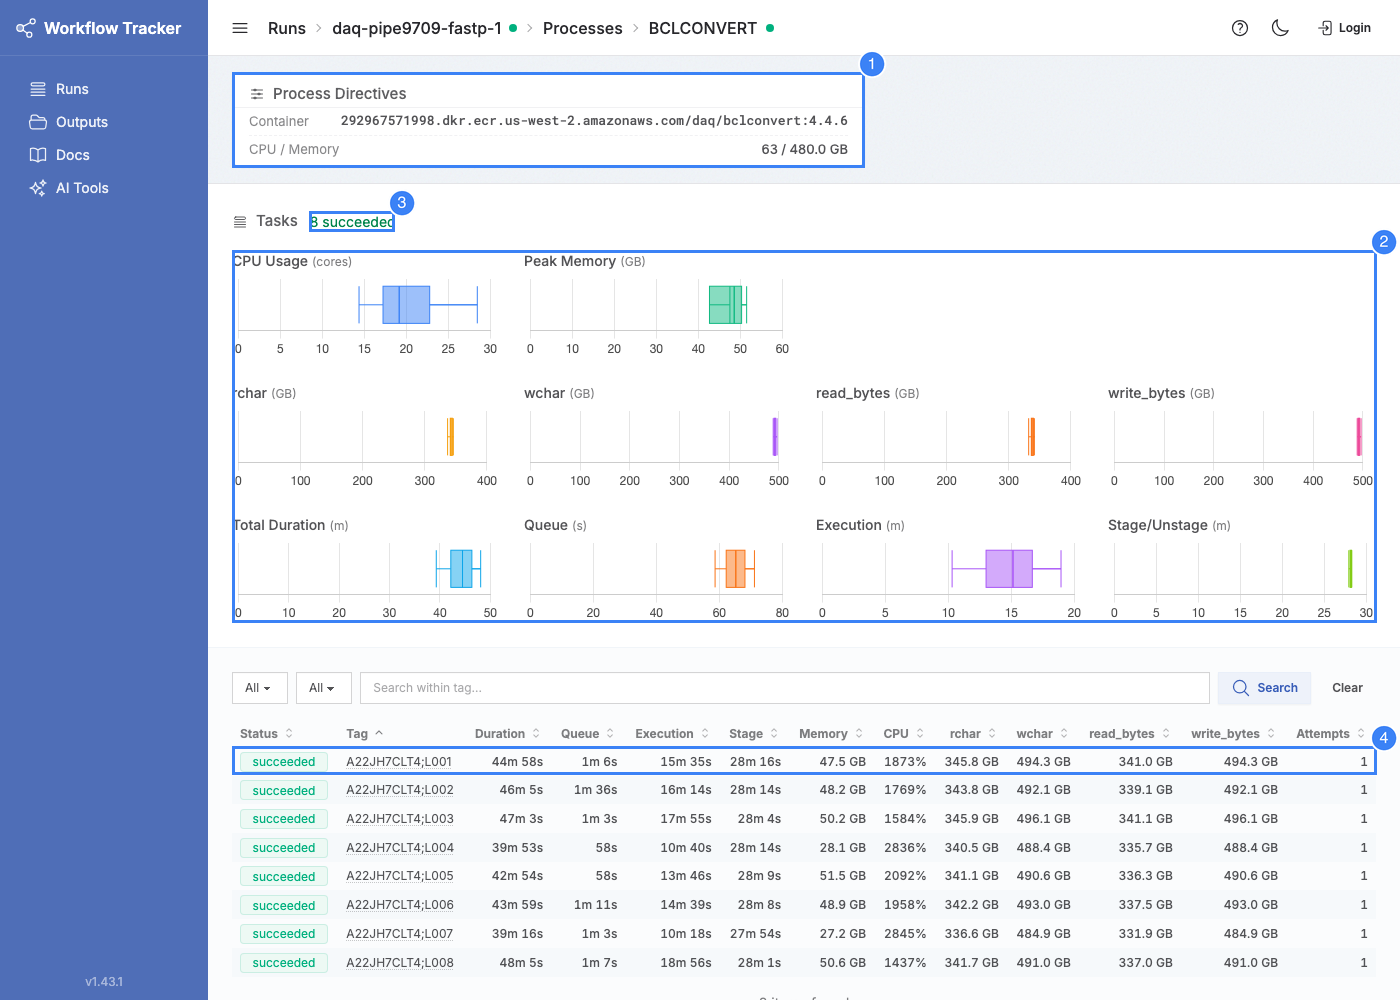
Process Directives
A card at the top shows the resource allocation for this process: CPU, Memory, and Container image. These reflect the Nextflow process directives from the workflow definition.
Box Plot Charts
Box plots (min, Q1, median, Q3, max) visualize the distribution of resource usage and timing across all tasks (latest attempt per task).
Resource Charts
| Chart | Description |
|---|---|
| CPU % | Actual CPU utilization. Compare against allocated CPUs to spot over/under-provisioning. |
| Peak RSS | Peak memory used. Compare against allocated memory. |
| Read/Write I/O (physical) | read_bytes / write_bytes -- actual storage device I/O |
| Read/Write I/O (logical) | rchar / wchar -- total I/O as seen by the process |
Physical vs Logical I/O
The process detail page shows two pairs of I/O charts because Linux tracks I/O at two levels:
read_bytes/write_bytes(physical) -- Bytes actually read from or written to the storage device. This is the I/O that hits disk.rchar/wchar(logical) -- Total bytes the process requested to read or write, including data served from the operating system's page cache.
rchar/wchar will typically be higher than read_bytes/write_bytes because:
- Shared reference files (genomes, indexes) are often already in the page cache from other tasks on the same node. The process reads them (
rcharincreases), but no physical disk I/O occurs (read_bytesstays low). - Buffered writes are counted in
wcharwhen the process writes, but may not be flushed to disk until later.
In practice: use rchar/wchar to understand how much data a task processes, and read_bytes/write_bytes to understand actual storage load.
Timing Charts
| Chart | Description |
|---|---|
| Queue Duration | Submission to execution start (waiting for a node) |
| Execution Duration | Task command wallclock time |
| Overhead Duration | File staging and unstaging time (total minus execution minus queue) |
| Total Duration | End-to-end time from submission to completion |
Units auto-scale: bytes use binary units (B through TB), time uses seconds/minutes/hours based on the dataset.
Task Table
Lists all tasks for this process. Click any row to open the task detail page.
Columns
| Column | Description |
|---|---|
| Status | Task status |
| Tag | Task tag, as defined in the workflow's process code. Links to a cross-process view of all tasks with the same tag. |
| Duration / Queue / Execution / Stage | Timing breakdown |
| Memory / CPU | Peak RSS and CPU utilization |
| rchar / wchar / read_bytes / write_bytes | I/O metrics |
| Attempts | Number of execution attempts |
Filtering
- Status filter -- Show only tasks with a specific status
- Minimum attempts -- Show only retried tasks (at least N attempts)
- Text search -- Filter by task tag
Filtered Box Plots
All filters also update the box plot charts, so you can analyze resource usage for a specific subset of tasks (e.g., only failed tasks).
All columns are sortable -- useful for identifying outliers (e.g., sort by memory descending to find the highest consumers).