Task Timeline
A Gantt-style visualization of task execution within a workflow run. Available as a tab on the run detail page.
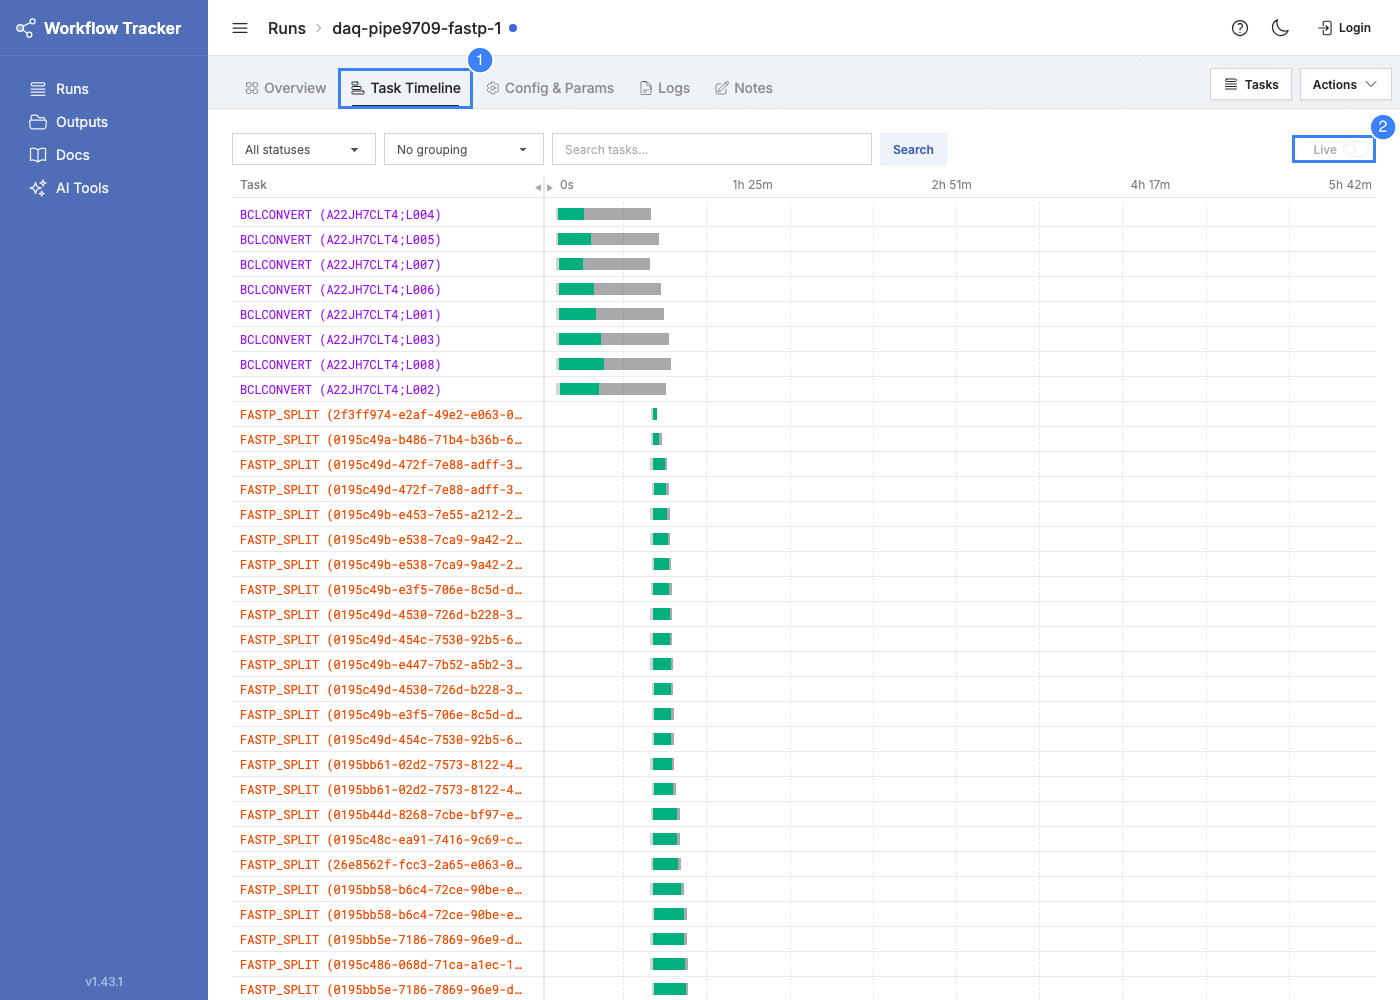
Reading the Timeline
Each row is a task. Bar width is proportional to duration relative to the total workflow time. Tasks are sorted by start time (30-second buckets), then by completion time within each bucket.
Phases
Each bar shows up to three segments:
| Phase | Color | Meaning |
|---|---|---|
| Queue | Gray | Waiting for a K8s node |
| Execution | Status color | Task command running |
| Overhead | Lighter status color | File staging and unstaging (total minus execution minus queue) |
Status Colors
Succeeded = green, Failed = red, Running = blue, Aborted = orange, Pending/Submitted = gray.
Other Visual Cues
- Process name colors -- Task names in the left column are colored by process, making it easy to distinguish which process each task belongs to.
- Time markers -- The x-axis shows elapsed time at 0%, 25%, 50%, 75%, and 100%.
- Multi-attempt tasks -- Each attempt gets its own bar. Failed attempts appear in red, the final success in green.
Filtering
Search by task name and filter by status using the controls within the timeline tab. The timeline re-renders to show only matching tasks.
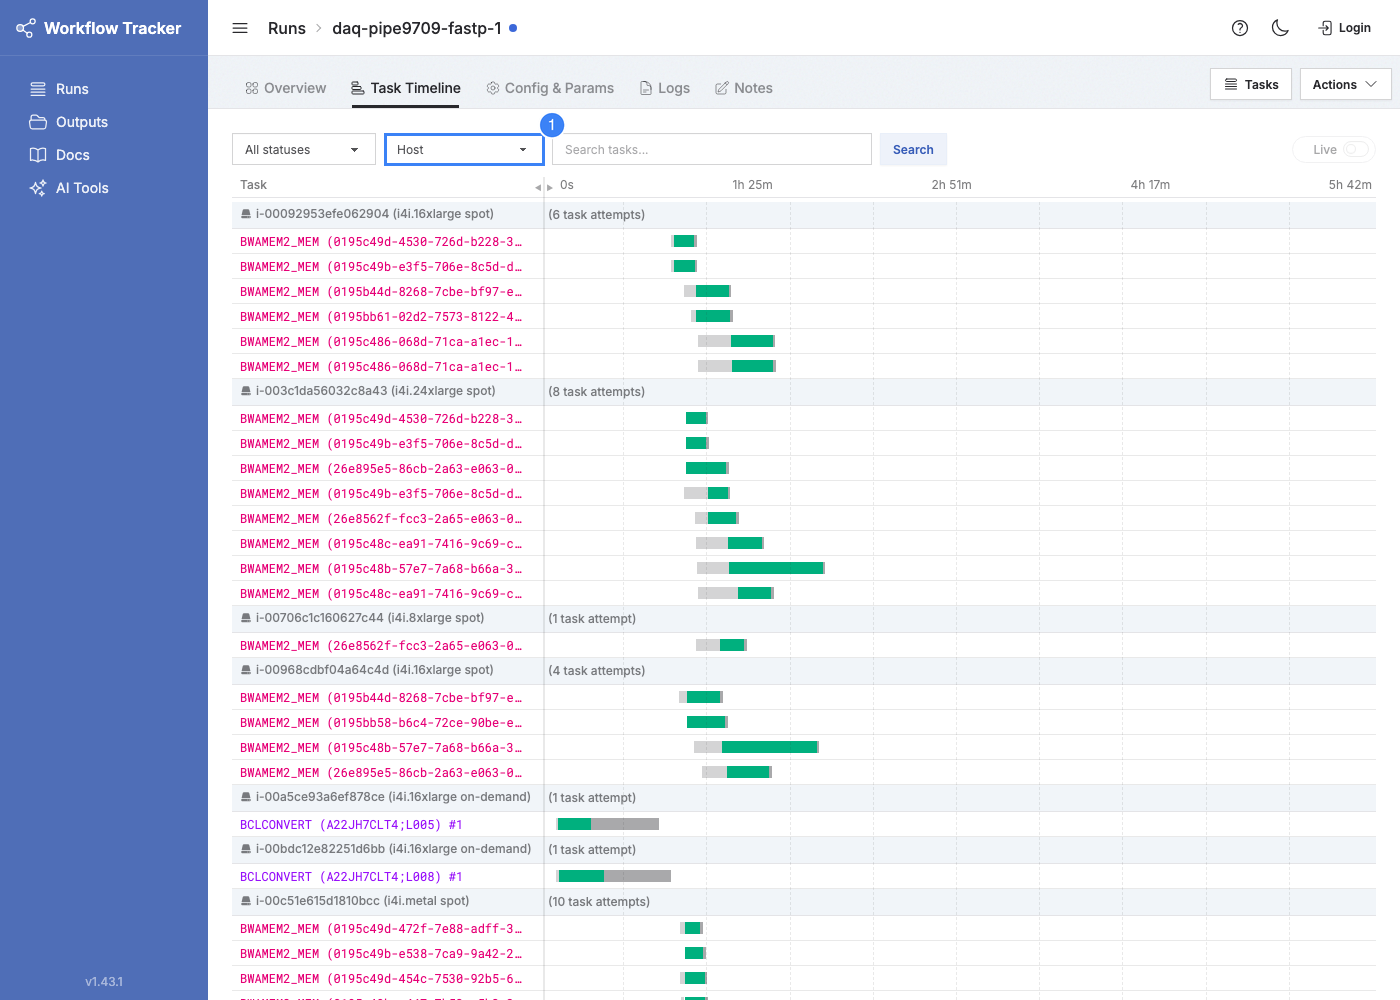
Grouping
| Grouping | Description |
|---|---|
| No grouping | Default. Tasks listed individually by timing. |
| Host | By K8s node (hostname, instance type, capacity type). Useful for spotting host-level failures. |
| Instance Type | By EC2 instance type (e.g., m5.4xlarge, r5.8xlarge). Shows work distribution. |
| Capacity Type | Spot vs. on-demand. Shows how much work ran on spot. |
When grouping is enabled, rows switch to attempt-level (one row per attempt) with group headers showing attempt counts.
Click any task bar or name to open the task detail page.